The Self-Sorted Market:
RWAs and Chain Specialization
in H1 2026
Introduction
The tokenization of real-world assets has progressed from an experimental use case into one of the most actively developing segments of on-chain finance, spanning stablecoins, tokenized treasuries and money market funds, gold, equities, private credit, and an emerging derivatives layer. As the category has matured, the defining question has shifted from whether real-world assets can scale on-chain to where that activity concentrates and which infrastructure captures it.
A defining characteristic of the first half of 2026 is that this expansion has self-sorted rather than fragmented, with individual chains attracting the asset categories best aligned to their infrastructure, liquidity profile, cost structure, and user base. This indicates that competitive positioning is increasingly determined by functional fit between a network and the requirements of a specific asset class, and it underscores that chain-level specialization is becoming a primary determinant of where future RWA growth accrues.
Co-authors


Key Takeaways
01.
RWA growth in market capitalization outpaced stablecoins’ by 8x, expanding roughly 20-fold between January 2024 and June 2026 to $33 billion, against a 2.4-fold increase in stablecoins.
02.
Stablecoin real-world payment activity rose 27.8% in H2 2025 over H1 2025 and continued the momentum into H1 2026, with TRON accounting for roughly 67% of volume at $700 million to $1.8 billion in weekday throughput. Monthly card volume excluding top-ups rose 36-fold from $7.46 million in early 2025 to a peak of $269.44 million in May 2026.
03.
Ethereum retained the leading share across institutionally oriented categories, including 52.7% of stablecoin supply, approximately 96% of tokenized gold, and 42% of both treasury and private credit issuance. Yet its tokenized-treasury share eroded from approximately 80% to 42%, indicating that its leadership is sustained by depth of institutional adoption rather than uniform category control.
04.
Solana is the fastest-growing venue across categories, leading tokenized-equity trading at 62.3% share by June 2026, recording the highest average quarter-over-quarter tokenized gold growth at 213.2%, and leading private credit collateral supply at $608.9 million.
05.
Hyperliquid established dominance in RWA perpetuals with monthly volume near $83.68 billion and open interest of $2.87 billion, while Solana emerged as an early competing venue oriented toward foreign exchange exposure.
06.
The launch of shared, permissionless exchange infrastructure such as OKX's ExchangeOS indicates that the next phase of specialization may center on which infrastructure layer minimizes the cost of deploying compliant, liquidity-unified markets.
What Experts Say

Asset Growth and Chain Concentration
Market Overview
The real-world asset (RWA) market sustained rapid expansion through the first half of 2026, with total distributed market capitalization surpassing $33 billion at peak. This reflects approximately 200% year-over-year growth, advancing from $11 billion to $33 billion and underscoring the segment's transition from an emerging niche toward an increasingly established component of on-chain financial infrastructure.
For context, RWA growth velocity has materially outpaced that of stablecoins, the most mature tokenized-asset category. Between January 2024 and June 2026, stablecoin market capitalization expanded roughly 2.4x, whereas RWA market capitalization grew approximately 20x over the same interval. This divergence is evident in relative scale: RWAs represented 1.34% of stablecoin market capitalization in 2024 but had risen to 11% by 2026, indicating accelerating adoption and a steadily narrowing gap between the two segments.

Stablecoins as Payments
Stablecoin market capitalization expanded only marginally year-to-date, advancing from $308.9 billion to $315.9 billion and indicating a phase of maturation in which incremental supply growth has slowed relative to prior cycles. Distribution across chains remained highly concentrated: Ethereum retained its leading position at 52.7% of total supply, followed by Tron at 28.3%, BNB Chain at 5.3%, and Solana at 5.1%. This concentration underscores the persistence of a small number of dominant settlement layers despite broader ecosystem expansion.
Beyond their established function as collateral and trading instruments within DeFi, stablecoins have increasingly served as a settlement medium for real-world payments, an application that has emerged as one of the segment's primary growth vectors. Real-world payment activity sustained the momentum established in January 2025 despite intervening market volatility. Tron consistently accounted for roughly 67% of total payment volume across the period, with weekday volumes typically ranging from $700 million to $1.8 billion. This aligns with the heavy use of USDT on Tron for cross-border remittances and peer-to-peer transfers, particularly across emerging markets, and demonstrates the chain's positioning as the primary settlement venue for payment-oriented stablecoin flows.
By contrast, Ethereum processed only $70–170 million per day in real-world payments despite its standing as the largest DeFi chain, frequently trailing BNB Chain on this metric. This divergence indicates that the majority of Ethereum-based stablecoin activity reflects DeFi and trading usage rather than settlement, highlighting a functional separation between chains optimized for financial-application throughput and those optimized for payments.
In aggregate, real-world stablecoin payment activity recorded 27.8% growth in H2 2025 compared to H1 2025, while keeping the momentum into H1 2026. Payment volumes consistently declined 20–30% on weekends across all chains, a pattern that indicates these flows are predominantly genuine commercial and business payments rather than crypto-native activity.
Within this segment, card-linked payments emerged as a fast-growing component, with total monthly volume excluding top-ups surging 36x from $7.46 million at the beginning of 2025 to a peak of $269.44 million in May 2026. The market underwent a pronounced rotation across chains, with leadership migrating from a single early incumbent toward a cluster of Ethereum layer-2 networks. In January 2025 the segment was highly concentrated on Gnosis, which captured roughly 72% of monthly volume; by June 2026 Gnosis held approximately 2.5%, its absolute volume having remained broadly flat near $10 million for 7 months before declining to $6.6 million in June, while the surrounding market expanded around it.
Optimism emerged as the dominant venue at roughly 35% share in June 2026, scaling from approximately $1 million per month through most of 2025 to a peak of $95 million in May 2026. Solana advanced to second at approximately 26%, rising from negligible activity before mid-2025 to roughly $69 million; and Base reached approximately 17% at $47 million, with Arbitrum holding a steady 7-10%.
As payments emerge as the next frontier for stablecoin utility, a growing cohort of purpose-built payment chains has entered the field, with Plasma and Tempo representing the two most prominent mainnets in this category. Plasma has established the larger footprint to date, with cumulative transfer volume surpassing $162 billion between October 2025 and June 2026, of which 84% was denominated in USDT. Tempo, by comparison, remains at an earlier stage of development, recording a modest cumulative transfer volume of $499.66 million between April and June 2026. Activity nonetheless strengthened materially over the period, with the daily weekday average rising to approximately $9 million across May and June from roughly $2.5 million at the start of the year.
Tokenized Gold
Tokenized gold recorded pronounced expansion over the analyzed period, with market capitalization rising from $950 million in January 2024 to a peak of $6.1 billion in February 2026 before settling at $4.8 billion. The retracement from peak levels reflects a partial unwinding of the demand that accompanied the early-2026 gold rally, though current capitalization remains more than five times its January 2024 base, indicating durable structural growth in the category.
The segment remains concentrated among two dominant instruments: PAXG, live onchain since 2019 and issued by Paxos Trust Company, N.A., a U.S. national trust bank regulated by the OCC, and Tether’s XAUt launched in 2020. A second wave of instruments, including XAUM and PGOLD, has since entered the market, reflecting broadening competition and the continued migration of gold-backed supply onchain.
Chain distribution is heavily concentrated on Ethereum, which holds approximately 96% of tokenized gold supply, a position derived from its incumbency as the issuance venue for both leading instruments since inception. This concentration underscores Ethereum's role as the primary settlement layer for established tokenized-commodity assets. Quarter-over-quarter growth, however, shows a different picture of where growth is heading. On average, Solana recorded the highest of 213.2% increase in tokenized gold market cap, followed by Polygon (202.18%), Base (153.48%), and Arbitrum (68.19%).
Trading volume rose sharply in early 2026, coinciding with the concurrent rally in spot gold prices. Approximately 90% of this volume was captured on centralized exchanges, indicating that price discovery and liquidity for tokenized gold remain predominantly centralized despite the assets' onchain issuance.
Among onchain venues, Ethereum naturally captured the largest share of trading activity, followed by Solana, where XAUt0 accounted for the majority of flow and cumulative trading volume reached $389.63 million in 2026. This distribution demonstrates that while liquidity remains anchored to Ethereum, alternative chains have begun to capture incremental onchain volume through specific instruments, reflecting early diversification of settlement venues within the category. With PAXG officially launching on Solana via Sunrise on June 25, the competition in the next six months will be fiercer.
Tokenized Equities
Tokenized equities constitute one of the youngest segments in the RWA landscape, having existed for approximately one year while rising to a peak market capitalization of $1.7 billion. Monthly trading volume expanded sharply from December 2025 onward, averaging $1.5 billion against roughly $500 million in the preceding months. The segment is led by two issuers: Ondo at $1.02 billion in market capitalization and xStocks at $485.96 million. xStocks, however, had a more robust user base with 271,259 cumulative holders compared to Ondo’s 134,826 holders by the end of June 2026. In Q2 2026, token supply was distributed evenly across three main competing chains, with Solana, BNB Chain, and Ethereum each accounting for roughly 30% of total market capitalization.
Trading activity, however, diverged markedly from this balanced supply profile over the December 2025 to June 2026 window, indicating that comparable market capitalization has not translated into comparable liquidity. BNB Chain volume fluctuated within a $1–2 billion monthly range, with the majority driven by Ondo Global Markets and powered by 1inch. On the other hand, Solana recorded consistent and rapid expansion, advancing from $160 million in December 2025 to a peak of $3 billion in June 2026.
The surge in June was driven largely by xStocks, which processed $2 billion in trading volume of which $1.3 billion originated from SPYx. The trajectory was reinforced by SPCX — tokenized SPCX by Backpack Securities via Sunrise — which recorded $500 million within two weeks of launching on Solana concurrent with its Nasdaq listing. These dynamics demonstrate that Solana is capturing share at an accelerating pace, with June 2026 marking the first month of the year in which it led all chains in tokenized-equity trading volume at 62.3% market share — evidence that liquidity within the category is consolidating onto the venue most effective at hosting high-profile equity issuances.
Tokenized Treasuries and Money Market Funds
Tokenized U.S. Treasuries and money market funds recorded one of the steepest expansions of any RWA category, with aggregate market capitalization rising from $11.65 million in January 2024 to $1.47 billion in January 2025 and reaching a peak of $15.86 billion in May 2026—an increase spanning more than three orders of magnitude over the period. Supply remained concentrated among a small set of instruments, led by USYC at $2.99 billion, BUIDL at $2.62 billion, and USDY at $2.13 billion. Ethereum continued to hold the largest share of issuance at 42%, though this represents a substantial erosion from approximately 80% across 2024 and the first half of 2025, with the displaced share accruing primarily to BNB Chain at 22% and Stellar at 10%. This redistribution indicates a gradual diversification of settlement venues even as Ethereum retains its dominant position.
Unlike other tokenized assets, these instruments exhibit no onchain secondary trading, a function of their design: tokenized treasuries and money market funds are accessible only to accredited and whitelisted holders, precluding retail participation.
Private Credit
Tokenized private credit reached an all-time high in represented market capitalization at $23.2 billion, driven largely by Figure HELOC on Provenance at $18.56 billion, which alone accounts for the substantial majority of the category's represented value.
Distributed market capitalization—reflecting tokens actively circulating on-chain—reached a separate all-time high of $6.92 billion in March 2026 before settling at $5.9 billion. Issuance remained concentrated among a small group of providers, led by Maple at 23.34% (syrupUSDC and syrupUSDT), STOKR at 21.76% (BMN2 and PKH2), and Centrifuge at 11.96% (JAAA). By chain, Ethereum led distribution at 42%, followed by Liquid Networks at 21.75%, Solana at 17.12%, and Stellar at 8.55%, indicating a more diversified settlement base than is observed in most other RWA categories.
In practice, private credit tokens function predominantly as collateral within lending markets, where they are deployed to borrow other assets—most commonly stablecoins. This usage is expressed across multiple ecosystems through distinct integrations. On Solana, Kamino operates three isolated RWA markets—PRIME, collateralized by Hastra's PRIME; OnRe, collateralized by OnRe's ONyc; and Maple, collateralized by Maple's syrupUSDC—alongside JupLend's syrupUSDC pool, also sourced from Maple.
On Ethereum, Morpho Blue hosts three principal syrupUSDC vaults issued by Maple and a WJAAA vault issued by Centrifuge, supplemented by Aave Horizon's JAAA pool (Centrifuge) and SYRUPUSDT pool (Maple). On Plasma, Mantle, and Base, deployment occurs through a single Aave v3 vault per chain, collateralized by Maple's SYRUPUSDT on Plasma and Mantle and by Maple's SYRUPUSDC on Base.
For context, Solana leads in total collateral supply at $608.9 million, having peaked at $1.18 billion in March 2026. Plasma ranks second at $286.06 million—a notable position given its relatively recent emergence—followed by Ethereum at $169.97 million and Mantle at $90.54 million. This ordering indicates that collateral concentration does not strictly follow issuance distribution, where Ethereum remains dominant, and underscores that newer high-throughput chains are capturing a disproportionate share of private credit's active lending utility as the segment's infrastructure continues to mature.
RWA Perpetuals
The RWA perpetuals sector expanded sharply in 2026, with activity on Hyperliquid scaling across every dimension. Monthly volume almost quadrupled from $21.6 billion in January to $83.68 billion in June, while average open interest grew more than six times from $422.6 million to $2.87 billion. Trade count roughly quadrupled in parallel, from 11.9 million in January to 45.85 million in June, supported by an increase in active markets from 22 to 84.
Within RWA markets on Hyperliquid, U.S. equities constituted the leading sector by open interest at $1.8 billion, followed by indices at $687.5 million and commodities at $498.3 million. This composition indicates that demand has concentrated most heavily in equity exposure, with index and commodity products forming a secondary tier.
Solana exhibited the same directional trend of rising RWA volume and open interest, though its sectoral distribution diverged. Foreign exchange constituted the most active category at $155 million in open interest, well ahead of commodities at $34 million, equities at $9 million, and indices at $742,000, indicating that Solana's RWA perpetuals demand is oriented toward currency rather than equity exposure.
Monthly volume on the chain advanced from $614 million in January to $34.17 billion in May, with open interest peaking at $221 million in the same month. For context, Solana remains substantially smaller than Hyperliquid in absolute terms, a function of its later-starting ecosystem, but its growth velocity is higher—underscoring that while Hyperliquid retains the dominant position in RWA perpetuals, the competitive gap is narrowing as newer venues scale from a lower base.

The Four Chain Archetypes
The category-level analysis demonstrates that RWA growth has not distributed uniformly across the ecosystem but has organized into distinct chain specializations, with individual networks capturing the asset types best aligned to their infrastructure, liquidity profile, and user base. Four chains—TRON, Ethereum, Solana, and Hyperliquid—represent the archetypes that define this self-sorting structure, each occupying a separate functional position within the broader RWA stack rather than competing for identical activity.
TRON — The Settlement Rail
TRON represents the settlement-rail archetype, optimized for high-volume, low-complexity value transfer. The chain consistently accounted for roughly 67% of real-world stablecoin payment volume, with weekday throughput ranging from $700 million to $1.8 billion, driven predominantly by USDT usage for cross-border remittances and peer-to-peer transfers across emerging markets. For context, its activity remains concentrated almost entirely in payments rather than tokenized-asset issuance or trading, which indicates that its specialization derives from reliability and cost efficiency at scale rather than ecosystem breadth. This underscores TRON's position as the primary settlement venue for payment-oriented stablecoin flows.
As more payment-focused networks such as Plasma, Tempo, and Arc expand their activities, TRON will face intense competitions going forward. The question remains whether TRON manages to keep its crown, or whether the payment sector will see a flip.
Ethereum — The Institutional Issuance Layer
Ethereum represents the institutional issuance archetype, functioning as the incumbent settlement layer for high-value and permissioned assets. It retained the leading share across the most institutionally oriented categories, holding 52.7% of stablecoin supply, approximately 96% of tokenized gold, 42% of tokenized treasury and money market fund issuance, and 42% of distributed private credit.
At the same time, its real-world payment throughput remained comparatively limited at $70–170 million per day, which indicates that the majority of its stablecoin activity reflects DeFi and trading usage rather than settlement. The erosion of its issuance share, most notably the decline from approximately 80% to 42% in tokenized treasuries, demonstrates that Ethereum's dominance, while structurally entrenched through incumbency, is gradually ceding ground as issuance diversifies across competing venues. This reflects a maturing position in which leadership is sustained by depth of institutional adoption rather than uniform category control.
Solana — The High-Velocity Liquidity Venue
Solana represents the emerging high-velocity archetype, capturing the fastest-growing and most retail-facing onchain liquidity. The chain advanced to leadership in tokenized-equity trading volume by June 2026, recorded the highest average quarter-over-quarter growth in tokenized gold market capitalization at 213.2%, led private credit collateral supply at $608.9 million, and reached approximately 26% of card-payment volume from a negligible base before mid-2025.
For context, Solana frequently remains smaller than incumbents in absolute terms, yet its consistently superior growth velocity across categories indicates that it is positioned as the primary venue for active onchain trading and liquidity formation as new RWA instruments scale. This underscores a trajectory in which adoption is driven by throughput and accessibility rather than incumbency.
Hyperliquid — The Specialized Derivatives Venue
Hyperliquid represents the specialized derivatives archetype, concentrated on synthetic exposure to real-world assets. It established a dominant position in RWA perpetuals, with monthly volume reaching $83.68 billion, open interest of $2.87 billion, and active markets expanding from 22 to 84, led by U.S. equity exposure at $1.8 billion in open interest. At the same time, this single-purpose orientation contrasts with the broader asset coverage of Ethereum and Solana, which indicates that Hyperliquid's specialization derives from purpose-built derivatives infrastructure rather than diversified issuance. This underscores its function as the leading venue for leveraged and synthetic RWA exposure.
At the same time, Solana is emerging as a competing venue for RWA perpetuals. While Solana remains substantially smaller than Hyperliquid in absolute terms, its higher growth velocity and distinct sectoral orientation toward foreign exchange exposure indicate that derivatives activity is beginning to diversify across venues. This reflects an early erosion of Hyperliquid's concentration and underscores that competition for RWA derivatives market share is intensifying as newer infrastructure scales from a lower base.
Looking Forward
As RWA activity intensifies across asset categories, competition is extending beyond individual chains toward the infrastructure layers on which trading venues are deployed. ExchangeOS, introduced by OKX's X Layer in May 2026, exemplifies this development: the protocol enables any builder to deploy spot, perpetuals, or outcomes venues on shared infrastructure, moving core exchange functions such as matching, margining, liquidation, settlement, and risk management to the protocol layer.
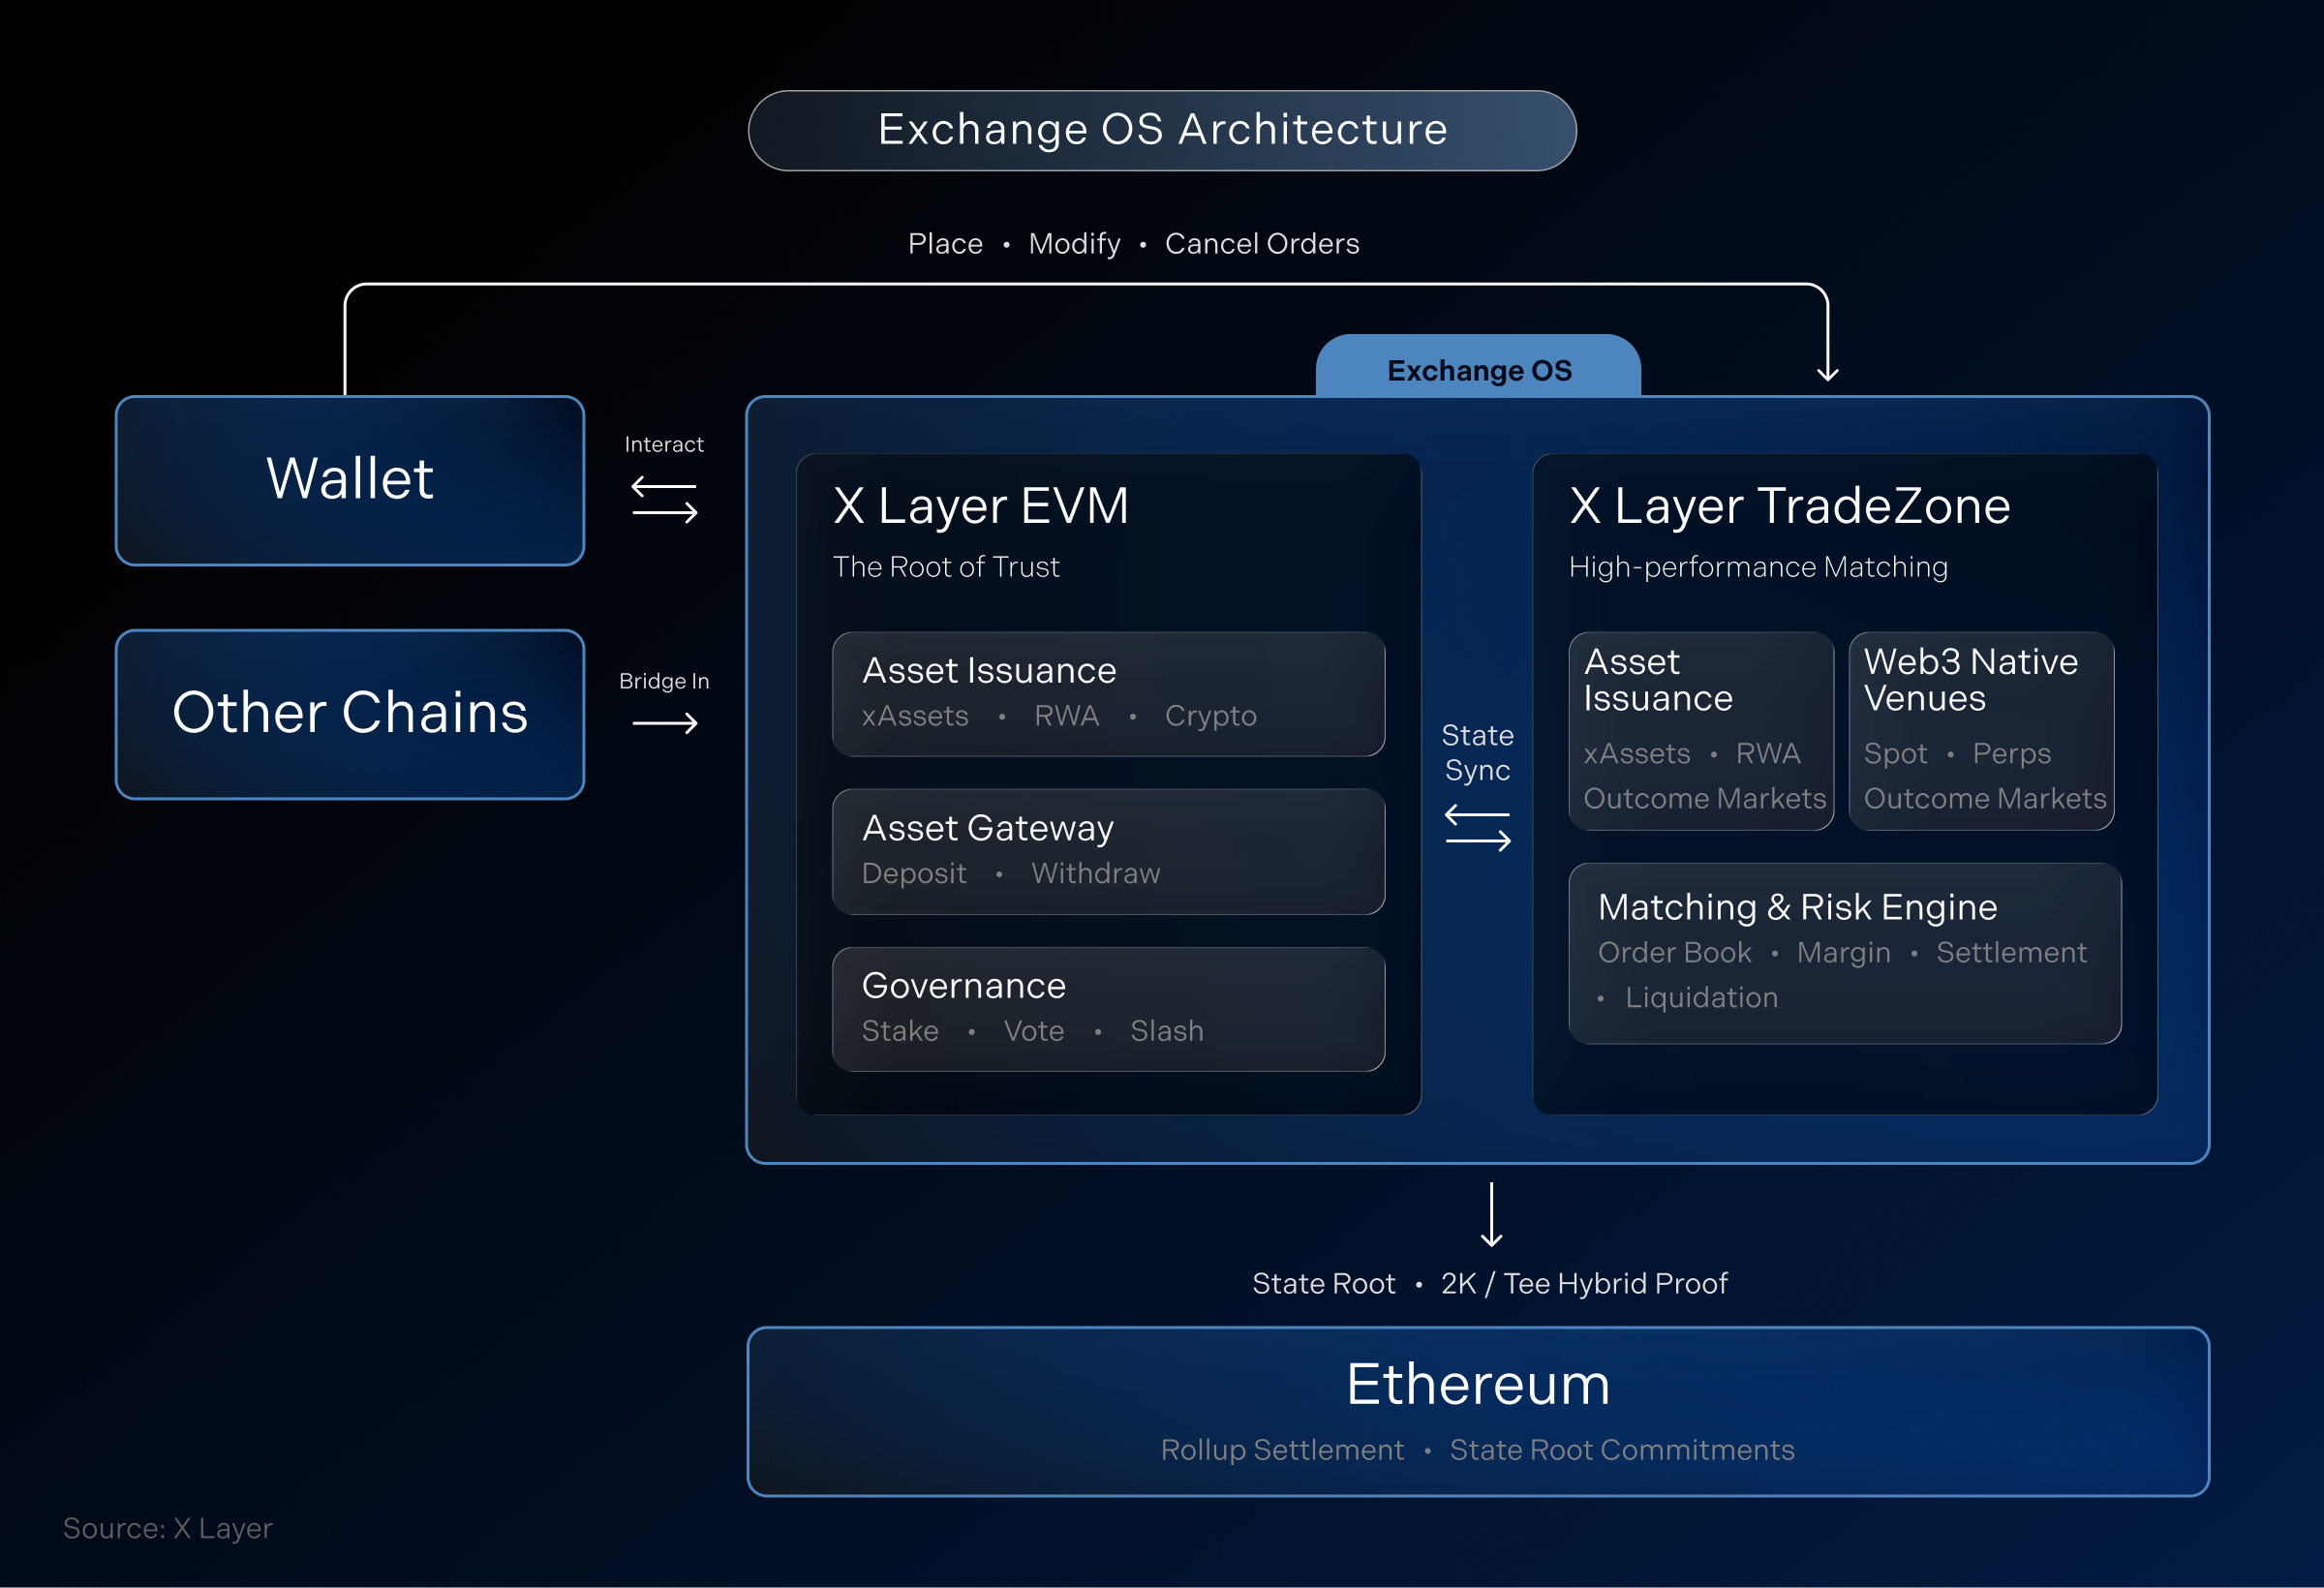
The orientation toward real-world assets is evident in its ecosystem composition, with day-one partners including xStocks, Centrifuge, and Maple Finance—three issuers central to the tokenized-equity and private-credit categories analyzed above—alongside infrastructure providers such as Chainlink and Pyth. This demonstrates that the next phase of chain specialization may be defined less by which network attracts a given asset than by which infrastructure layer enables venues to be deployed around it, and it underscores that as RWA adoption deepens, the chains and protocols that minimize the cost of launching compliant, liquidity-unified markets are positioned to capture a growing share of the segment's activity.
Conclusion
The first half of 2026 demonstrates that the RWA market has entered a phase defined less by aggregate expansion than by structural organization, with total distributed market capitalization surpassing $33 billion at approximately 200% year-over-year growth. For context, a 20-fold increase in RWA market capitalization since January 2024 against a 2.4-fold expansion in stablecoins indicates that tokenized real-world assets are scaling at a velocity materially exceeding the most mature on-chain asset class, even as they remain a fraction of its absolute size.
The defining characteristic of this period is that growth has self-sorted rather than fragmented, with each category concentrating on the infrastructure best suited to it. At the same time, the data demonstrates that incumbency does not guarantee durable dominance, as evidenced by Ethereum's decline from approximately 80% to 42% of tokenized treasury issuance, the rotation of card-payment leadership from Gnosis to a cluster of layer-2 networks, and Solana's ascent to the top of tokenized-equity trading volume. This underscores that chain-level positioning is increasingly determined by functional specialization and growth velocity rather than first-mover status, and it indicates that continued RWA growth is likely to reinforce these specializations as each network deepens its archetypal strengths.
Special thanks
We would like to express our sincere gratitude to partners and friends
who have supported us and provided data so that we can complete this report
Co-authors
Data providers